Farm equipment is one of the most mispriced asset classes in South African agriculture. In practice, many farmers either overestimate or underestimate value by 20–40%, usually based on purchase price memory, brand perception, or incomplete market comparisons.
The problem is not lack of effort—it is lack of structure. Most valuations are opinion-based rather than data-driven, which leads to poor selling decisions, inefficient trade-ins, and distorted market expectations.
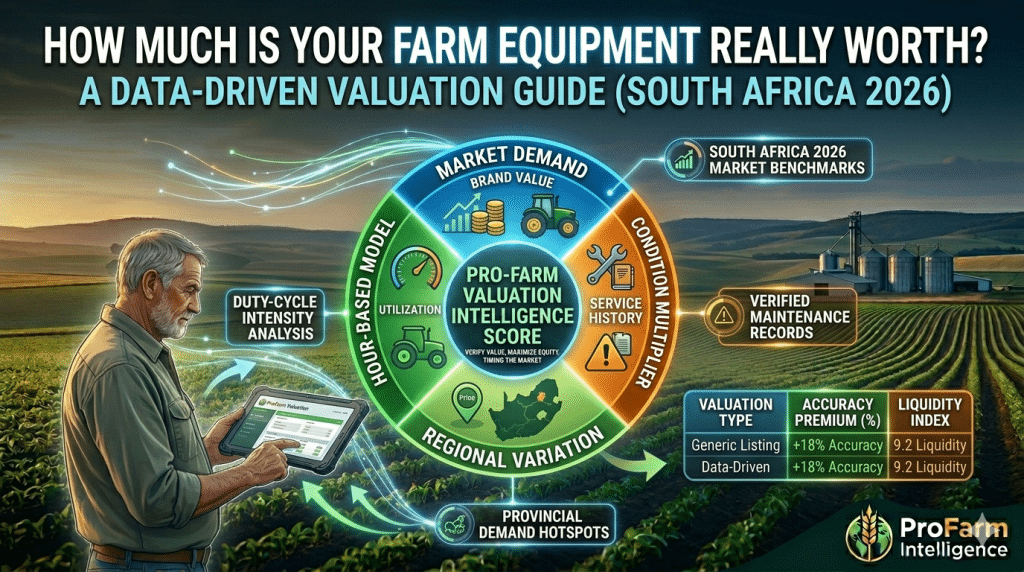
This guide introduces a structured valuation framework for agricultural equipment in South Africa, designed to move beyond guesswork into measurable asset intelligence.
Why Farm Equipment Valuation Is Complex
Unlike standard vehicles or fixed assets, agricultural machinery operates in a highly variable environment where value is influenced by both mechanical and market forces.
1. Equipment is usage-intensive, not time-intensive
Two identical tractors of the same year can have radically different value outcomes depending on:
- Operating hours
- Load intensity
- Maintenance discipline
A machine used lightly over long periods may outperform a heavily worked newer unit in resale value.
2. Agricultural demand is cyclical
In South Africa, equipment value fluctuates based on:
- Planting and harvesting seasons
- Regional crop cycles
- Input cost pressure (fuel, fertiliser, feed)
This means value is not static—it is temporally sensitive.
3. Regional market fragmentation
A tractor in the Western Cape may command a different price than the same unit in the Free State due to:
- Crop type differences
- Terrain suitability
- Dealer density
- Transport costs
Core Factors That Determine Farm Equipment Value
A reliable valuation model must combine mechanical condition with market dynamics.
Engine Hours (with limitations)
Engine hours remain the most referenced metric, but they are often misunderstood.
They do indicate usage, but they do not reflect:
- Load intensity
- Idle vs working hours
- Operator behaviour
- Maintenance quality
Hours are a baseline signal, not a final valuation determinant.
Machine Age and Model Year
Age affects value through:
- Technology relevance
- Parts availability
- Emissions compliance
- Hydraulic and electronic system updates
However, age alone is less important than condition and demand alignment.
Brand Strength and Market Trust
Brand reputation influences liquidity more than raw value.
Stronger resale performance is typically linked to:
- Parts availability
- Dealer support networks
- Reliability perception in the market
Brand strength directly affects how quickly equipment sells and at what discount level.
Maintenance History
Well-documented maintenance increases value due to reduced uncertainty.
Key indicators:
- Service logs
- Oil and filter consistency
- Major repair documentation
- OEM or certified servicing
Incomplete records introduce buyer risk discounts.
Condition Grading (A–D System)
A structured grading system improves objectivity:
- Grade A: Excellent condition, minimal wear, full service history
- Grade B: Good condition, minor wear, fully operational
- Grade C: Functional but shows moderate wear or minor issues
- Grade D: High wear, requires repair or refurbishment
Condition grading often impacts value more than age.
Data-Driven Valuation Model (Core Framework)
A practical valuation model can be structured as follows:
1. Base Market Value
Start with comparable market listings and historical sales benchmarks for the same model and year.
This establishes a baseline reference price.
2. Hour Adjustment Factor
Adjust value based on deviation from expected usage:
- Below average hours → premium adjustment
- Above average hours → discount adjustment
This must be calibrated per equipment category.
3. Condition Multiplier
Apply a multiplier based on condition grade:
- Grade A: 1.0–1.1
- Grade B: 0.85–1.0
- Grade C: 0.65–0.85
- Grade D: 0.4–0.65
Condition often has the highest impact on final value.
4. Demand Index Adjustment
Market demand fluctuates by season and region.
- High demand period → positive adjustment
- Oversupply period → downward adjustment
This is where many sellers lose value by ignoring timing.
5. Regional Market Adjustment
Final adjustment based on:
- Local buyer density
- Crop type demand
- Transport logistics
- Dealer competition
This ensures valuation reflects real market conditions, not theoretical averages.
Brand Value Retention Comparison (Market Behaviour Insight)
Different brands show different resale behaviour patterns due to market perception and support ecosystems.
Commonly Strong Retention Patterns
- High liquidity due to trust and parts availability
- Faster resale cycles
- Lower depreciation volatility
Moderate Retention Brands
- Stable but more price-sensitive
- Dependent on condition and hours
Lower Liquidity Brands
- Slower resale cycles
- Higher negotiation discounts
- More sensitive to market timing
The key insight is not preference—it is liquidity efficiency.
Real Market Pricing vs Asking Price
One of the most consistent inefficiencies in the agricultural equipment market is the gap between asking price and actual transaction value.
Why this gap exists:
- Emotional pricing based on purchase cost
- Lack of comparable data
- Overestimation of brand retention
- Delayed market feedback loops
In reality:
- Asking prices often exceed final sale prices
- Buyers discount aggressively for uncertainty
- Negotiation ranges can vary significantly
Understanding this gap is critical for realistic valuation.
Common Mistakes in Valuing Equipment
1. Over-reliance on original purchase price
Purchase price is irrelevant to current market value. The market only responds to current utility and demand.
2. Ignoring condition degradation
Small mechanical issues compound into large valuation discounts.
3. Misreading engine hours
Hours without context (usage type and load intensity) are misleading.
4. Emotional attachment bias
Personal ownership value rarely translates into market value.
5. Ignoring inventory levels
High market supply reduces pricing power regardless of equipment quality.
How to Estimate Your Equipment’s True Market Value
A structured approach improves accuracy significantly.
Step 1: Assess Condition Objectively
Use a grading system rather than subjective description.
Step 2: Compare Similar Listings
Identify:
- Same model
- Similar hours
- Comparable condition
Step 3: Adjust for Hours and Wear
Benchmark against expected usage curves.
Step 4: Factor in Demand Cycles
Align valuation with:
- Pre-planting
- Pre-harvest
- Off-season cycles
Step 5: Validate Against Market Reality
Cross-check expectations with:
- Dealer pricing
- Auction results
- Actual sale outcomes where available
FAQ
How do I calculate farm equipment value in South Africa?
Use a structured model combining base market price, condition grading, engine hours adjustment, demand cycles, and regional factors.
Do tractor hours or age matter more?
Hours generally matter more than age, but condition and maintenance history often outweigh both.
Why is my equipment worth less than I expected?
Most valuation gaps come from emotional pricing, outdated comparisons, or ignoring current market demand conditions.
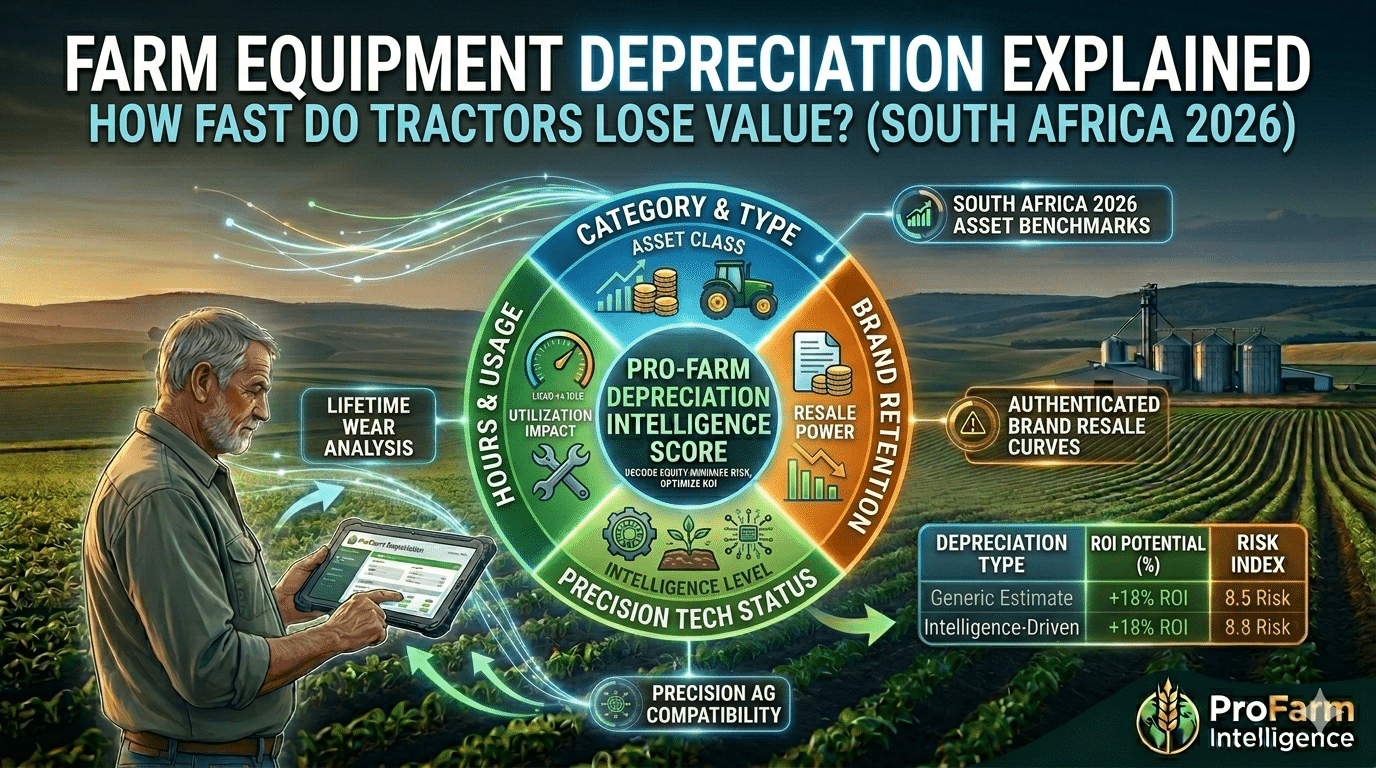
How often does farm equipment lose value?
Depreciation is non-linear and depends heavily on usage intensity, condition, and market demand cycles rather than fixed yearly rates.
Final Insight
Farm equipment valuation is not a single number—it is a structured interpretation of mechanical condition, usage history, and market dynamics.
When these factors are analysed correctly, valuation becomes less about estimation and more about evidence-based pricing intelligence.
In a market where timing, condition, and demand shift continuously, the most accurate valuations come not from intuition, but from structured data interpretation.