In the complex ecosystem of South African commercial agriculture, a tractor represents both massive capital expenditure and critical operational capacity. However, defining its “true value” at any point in its lifecycle requires more than a simple inspection or a glance at a calendar.
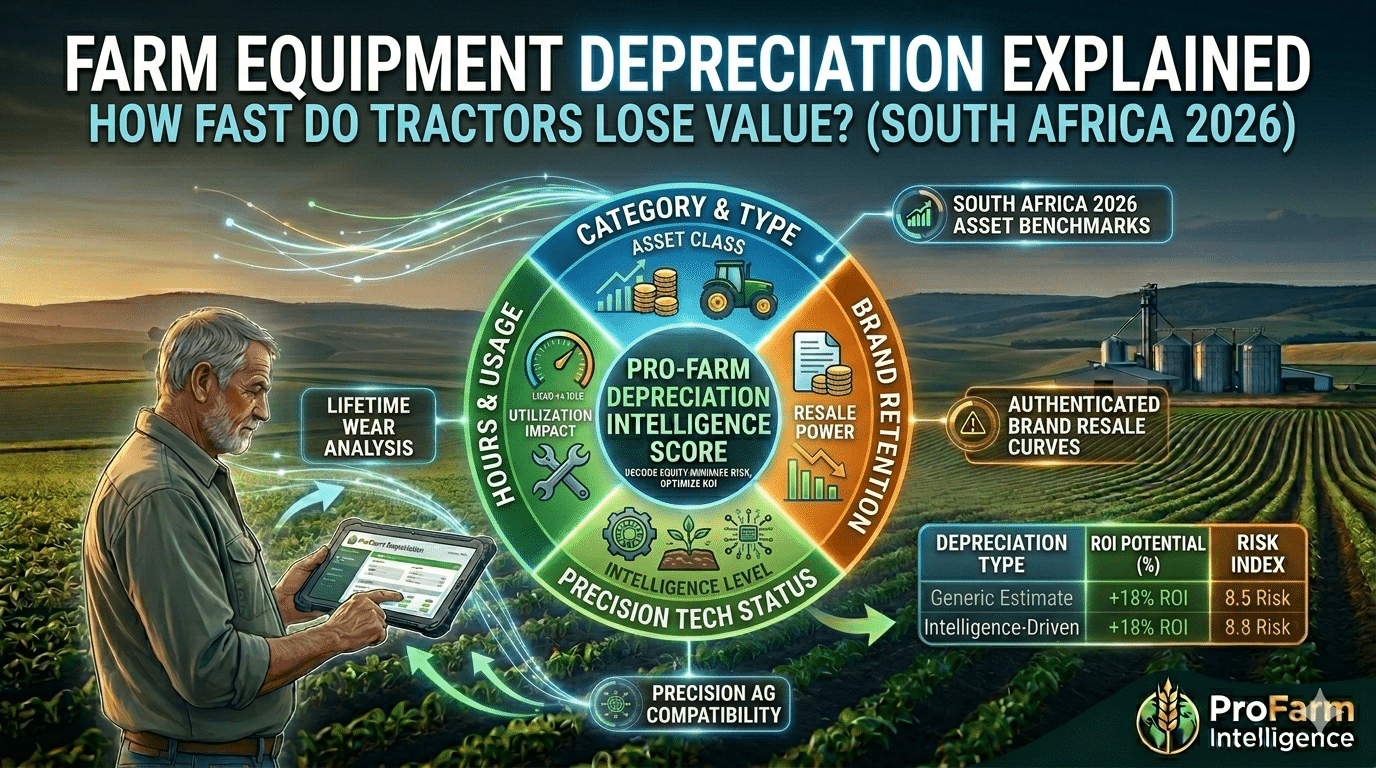
True valuation is an algorithmic intersection—a “Triad of Residual Value”—driven by:
- Model Type/Duty Cycle: What work was the machine *designed* to perform?
- Utilization (Hours): How many hours has the machine *actually* performed that work?
- Local Market Brand Strength: How robust is the parts availability and service network for that specific brand in South Africa?
At ProFarm Intelligence, our multi-year analysis of South African asset auctions and private sales shows that treating depreciation as a linear function of age or hours is a fundamental error. Understanding that different classes of tractors depreciate along profoundly different curves is the cornerstone of optimizing fleet turnover and maximizing residual equity.
Comparing the Curves: Detailed Duty-Cycle Analysis
To visualize this, we must segment the market into three primary categories and analyze their distinct depreciation behaviors.
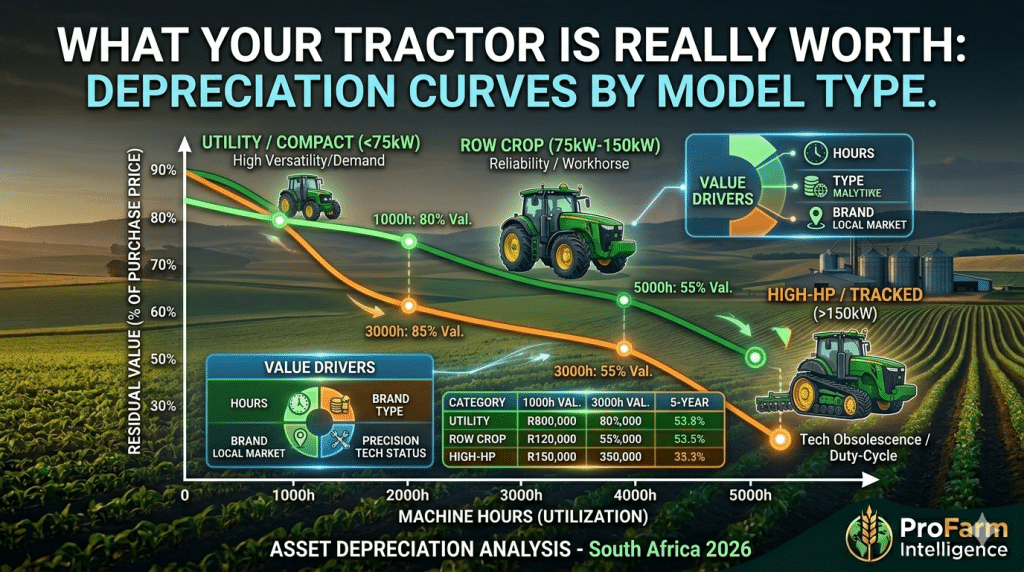
1. Utility / Compact Tractors (<75kW)
- The Curve: Shallow and extended.
- Analysis: These units are the versatile “Swiss Army Knives” of the farm—used in orchards, for transport, and for lighter field work. Because their demand is high across all farming sectors (including emerging and small-scale farmers) and they typically have lower complexity, their secondary market is exceptionally liquid. They retain high percentages of value even with elevated hours.
- Value Driver: Local market demand and mechanical simplicity outpace technical obsolescence.
2. Row Crop Tractors (75kW–150kW)
- The Curve: Steeper but linear.
- Analysis: These are the primary workhorses of row-crop and mixed farming (planting, tillage, spraying). Their duty cycle is consistent and heavy. Depreciation is directly correlated to engine and transmission hours and, crucially, verified maintenance history. A row-crop unit with unverified service logs in 2026 sees a 15–20% liquidity penalty compared to a fully documented peer.
- Value Driver: Component health and hours are paramount. Brand perception and dealer network reliability in South Africa heavily influence residual percentage.
3. High-Horsepower / Tracked Units (>150kW)
- The Curve: Steep initial drop with erratic volatility.
- Analysis: These machines represent peak capital outlay and peak duty-cycle stress (e.g., deep ripping). They are also the platforms where precision agriculture technology evolves most rapidly. A high-HP unit with five-year-old telematics or GPS architecture faces a “technology steep-drop.” The market increasingly demands machines capable of deep data integration; units with obsolete tech are heavily discounted, regardless of mechanical hours.
- Value Driver: Precision tech status and duty-cycle intensity. This class sees the greatest value volatility based on technological currency.
Understanding “The Hour Trap”
The most significant misinterpretation of value is equating “Total Engine Hours” with “Asset Wear.” You cannot compare hours between classes.
The ProFarm Hour Equivalence Model:
- A 1,000-hour utility tractor used for light orchard spraying is, in engineering terms, far “younger” than a 1,000-hour high-horsepower unit used strictly for primary tillage in heavy soils.
- Buyers on the secondary market are moving towards analyzing “Duty-Cycle Severity” rather than just total hours. Low hours with severe utilization (e.g., ripping) often destroy more value than high hours with light utilization (e.g., transport/spraying).
South Africa 2026: Strategic Valuation Analysis
Analysis Benchmarks based on 2026 Market Data.
| Tractor Class | Projected 5-Year Residual Value (Low Hours) | Projected 5-Year Residual Value (Verifiable Service History) | Impact of High-Severity Duty Cycle | Residual Value (Obsolete Precision Tech) |
|---|---|---|---|---|
| Utility (<75kW) | 60% – 65% | 62% | Minimum | Minimal Impact |
| Row Crop (75–150kW) | 50% – 55% | 53% | Moderate (–8%) | Moderate Impact |
| High-HP (>150kW) | 40% – 45% | 43% | High (–15%) | Severe Drop (–25%+) |
Note: Data represents residual value percentage of initial purchase price.
Conclusion: Move from Conjecture to Intelligence
Optimizing a large commercial farm’s fleet turnover is not an intuitive process; it is a quantitative challenge. Failing to understand that a high-horsepower unit depreciates exponentially faster in its technical stack than mechanically, or that the utility market maintains a unique floor, leads to massive equity loss at liquidation.
Is your fleet replacement cycle based on data or habit? Don’t rely on conjecture. If you manage a fleet exceeding ten units, contact ProFarm Intelligence to discuss our Asset Valuation API and personalized fleet audit services. Let us apply quantitative rigor to your equipment lifecycle.
ProFarm Intelligence – Transforming data into agricultural confidence.